こんにちは、habrの読者の皆様、2020年8月12日に、改修プログラムの下での移動の段階が公開されました(ここで見つけることができます)。これらの段階が視覚化された場合、どのように見えるか疑問に思いました。ここで、私はモスクワ政府とはまったく関係がないことを明確にする必要がありますが、私は改修のための建物のアパートの幸せな所有者なので、おそらく私の場合、改修の波がどこに移動するかを正確に推測しても、興味がありました(そしておそらくあなたの中で、あなたがこれに興味があるなら、親愛なる読者)。もちろん、正確な予測は機能しませんが、少なくとも新しい角度から画像を見ることができます。
UPD 2020年8月28日
リノベーションウェーブとローンチサイトがマークされた完全なリノベーションマップを入手しました。
前書き
12 2020 . № 45/182/-335/20 ( ) 2032 ( ):
- 2020 — 2024., 930 , 3-29
- 2025 — 2028., 1636 , 30-76
- 2029 — 2032., 1809 , 77-128
- ( 1 2021.) — 688 , 129-148
- , . , .
, .. — pdf , tabula pdf .
import pandas as pd
import numpy as np
import requests
from tabula import read_pdf
import json
import os
, , .
test = read_pdf('prikaz_grafikpereseleniya.pdf', pages='3', pandas_options={'header':None})test.head()| 0 | 1 | 2 | 3 | 4 | 5 | |
|---|---|---|---|---|---|---|
| 0 | No / | NaN | unom | |||
| 1 | 1 | ., .49 c.4 | NaN | 1316 | ||
| 2 | 2 | ., .77 c.3 | NaN | 1327 | ||
| 3 | 3 | ., .2/26 | NaN | 19328 | ||
| 4 | 4 | ., .3 | NaN | 31354 |
, , , parse_pdf_table.
def parse_pdf_table(pages, pdf_file='prikaz_grafikpereseleniya.pdf'):
    df = read_pdf(pdf_file, pages=pages, pandas_options={'header':None})

    #
    df = df[~(df.iloc[:,0] == 'No /')]

    #
    df = df.iloc[:,1:4]
    df.columns = ['AO', 'district', 'address']

    return df
, , .. , pdf . ( , .. )
wave_1 = parse_pdf_table('3-29') # 2020 - 2024
wave_1['wave'] = 1wave_1.shape(930, 4)wave_2 = parse_pdf_table('30-76') # 2025 - 2028
wave_2['wave'] = 2wave_2.shape(1636, 4)wave_3 = parse_pdf_table('77-128') # 2029 - 2032
wave_3['wave'] = 3wave_3.shape(1809, 4)unknown = parse_pdf_table('129-148')
unknown['wave'] = 0unknown.shape(688, 4) (pandas), df.
df = pd.concat([wave_1, wave_2, wave_3, unknown], ignore_index=True).
df['marker-color'] = df['wave'].map({1:'#0ACF00', #
2:'#1142AA', #
3:'#FFFD00', #
0:'#FD0006'}) # .
df['iconContent'] = df['wave'].map({1:'1',
2:'2',
3:'3',
0:''}).
df['description'] = df['address']— , , , , , . ( ! :)
def add_city(x):
if x['AO'] == '':
return ', ' + x['address']
return ', ' + x['address']df['address'] = df[['AO', 'address']].apply(add_city, axis=1)def geocoder(addr, key=' '):
url = 'https://geocode-maps.yandex.ru/1.x'
params = {'format':'json', 'apikey': key, 'geocode': addr}
response = requests.get(url, params=params)
try:
coordinates = response.json()["response"]["GeoObjectCollection"]["featureMember"][0]["GeoObject"]["Point"]["pos"]
lon, lat = coordinates.split(' ')
except:
lon, lat = 0, 0
return lon, lat%%time
df['longitude'], df['latitude'] = zip(*df['address'].apply(geocoder))CPU times: user 2min 11s, sys: 4.31 s, total: 2min 15s
Wall time: 15min 14s( , .. , ), - - .
len(df[df['longitude'] == 0])0.
df.to_csv('waves.csv')#df = pd.read_csv('waves.csv')def df_to_geojson(df, properties, lat='latitude', lon='longitude'):
geojson = {'type':'FeatureCollection', 'features':[]}
for _, row in df.iterrows():
feature = {'type':'Feature',
'properties':{},
'geometry':{'type':'Point',
'coordinates':[]}}
feature['geometry']['coordinates'] = [row[lon],row[lat]]
for prop in properties:
feature['properties'][prop] = row[prop]
geojson['features'].append(feature)
return geojson.. , , .
properties = ['marker-color', 'iconContent', 'description']
if not os.path.exists('data'):
os.makedirs('data')
for ao, data in df.groupby('AO'):
geojson = df_to_geojson(data, properties)
with open('data/' + ao + '.geojson', 'w') as f:
json.dump(geojson, f, indent=2) .geojson data. _.geojson .
geojson = df_to_geojson(df, properties)
with open('data/_.geojson', 'w') as f:
json.dump(geojson, f, indent=2) 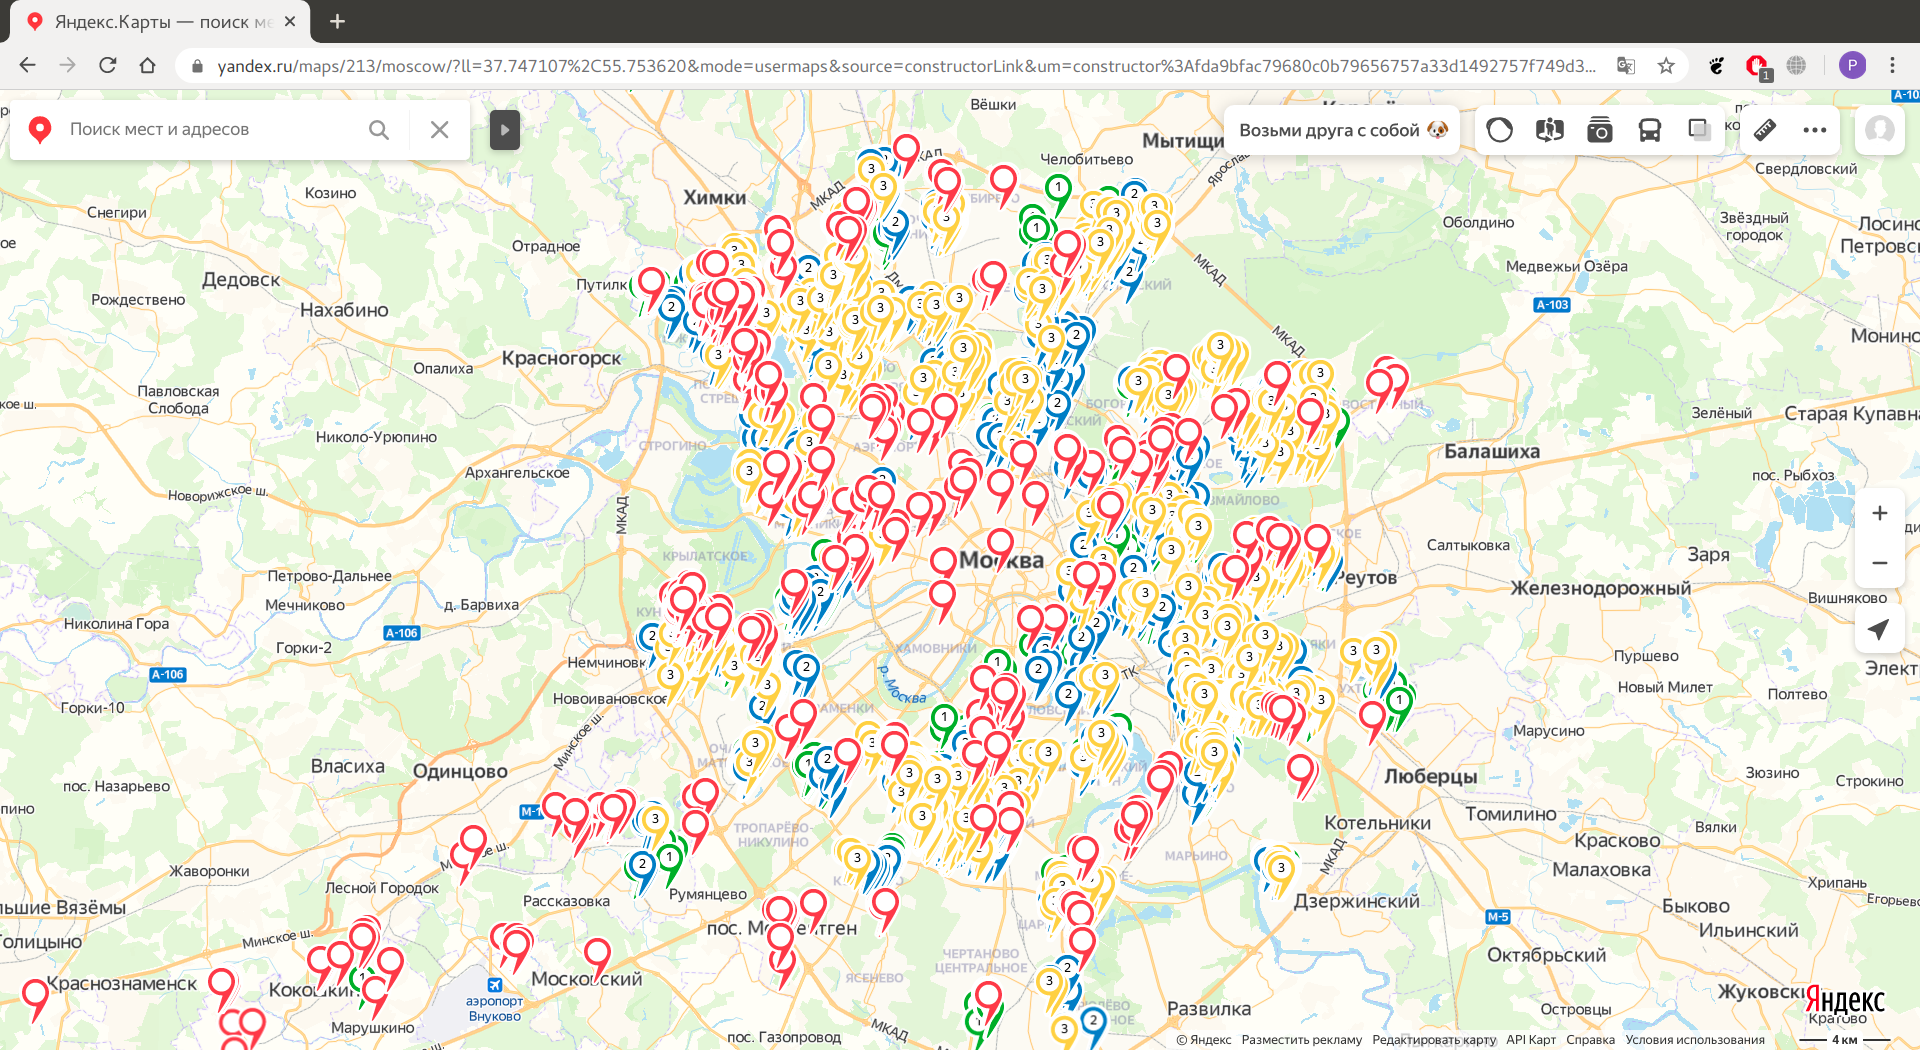

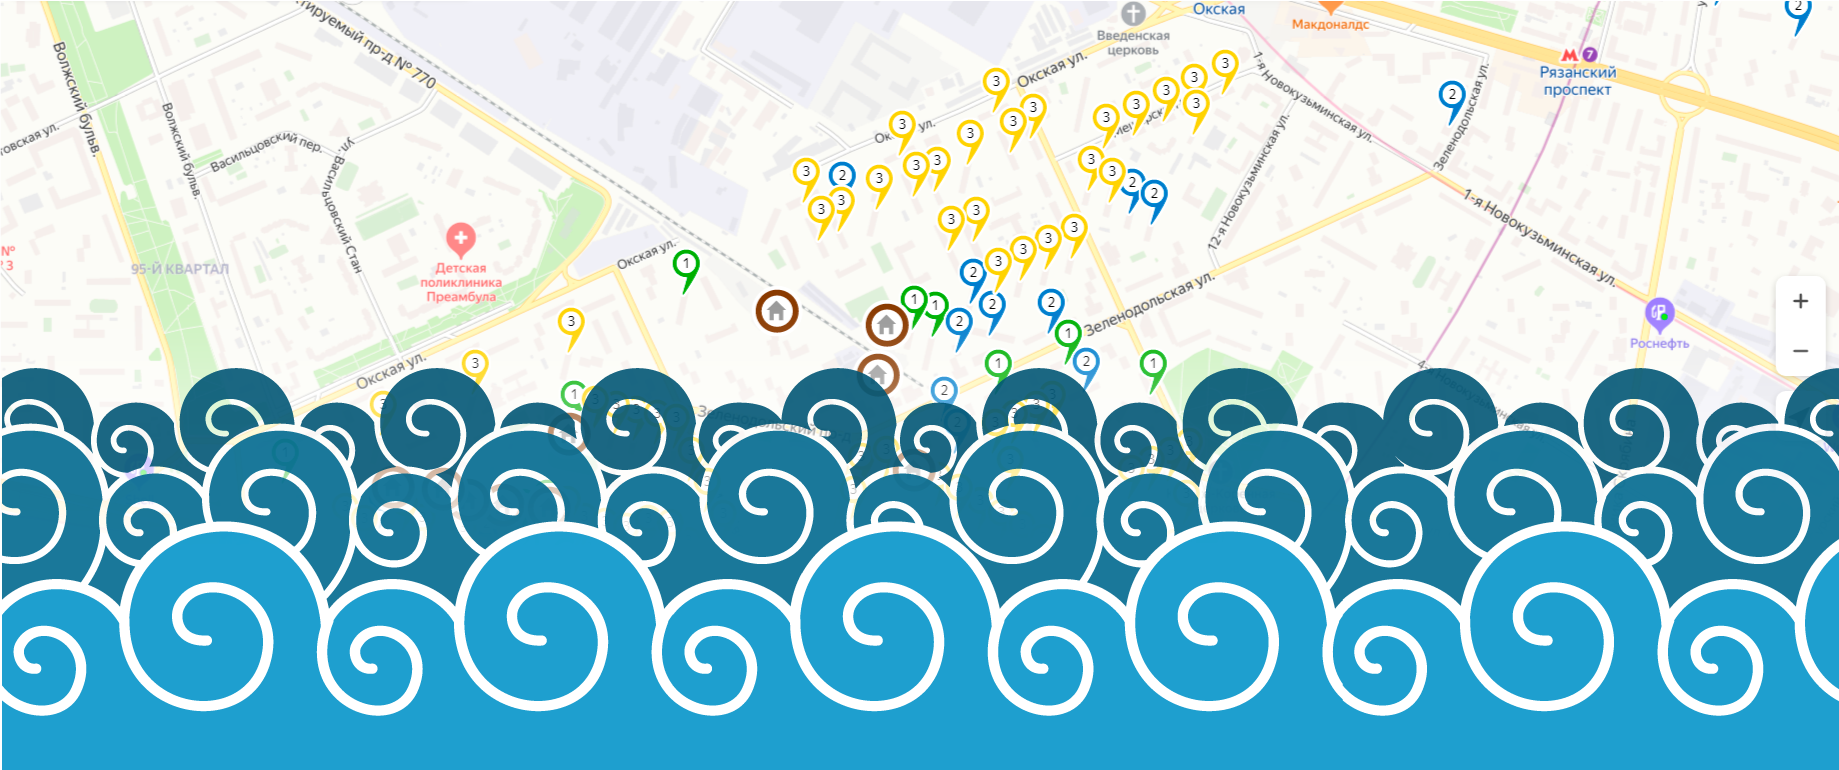
, , , , — (.), .1 - — . (. , .), .8//. ( , )
, :(
, . , , , , , , , . 39, , . 6, — , . 1, 2, 3, . 38.
— !

- , , . , PbIXTOP, .
2.0
import pandas as pd
import numpy as np
import json
from tabula import read_pdf
from tqdm.notebook import tqdm
import os
with open('renovation_address.txt') as f:
bounded_addresses = json.load(f)def parse_pdf_table(pages, pdf_file='prikaz_grafikpereseleniya.pdf'):
df = read_pdf(pdf_file, pages=pages, pandas_options={'header':None})
#
df = df[~(df.iloc[:,0] == 'No /')]
df['unom'] = df.iloc[:,-1].combine_first(df.iloc[:,-2])
#
df = df.iloc[:,[1, 2, 3, -1]]
df.columns = ['AO', 'district', 'description', 'unom']
return dfwave_1 = parse_pdf_table('3-29') # 2020 - 2024
wave_1['wave'] = 1
wave_2 = parse_pdf_table('30-76') # 2025 - 2028
wave_2['wave'] = 2
wave_3 = parse_pdf_table('77-128') # 2029 - 2032
wave_3['wave'] = 3
unknown = parse_pdf_table('129-148')
unknown['wave'] = 0df = pd.concat([wave_1, wave_2, wave_3, unknown], ignore_index=True)df['marker-color'] = df['wave'].map({1:'#0ACF00', #
2:'#1142AA', #
3:'#FFFD00', #
0:'#FD0006'}) #
df['iconContent'] = df['wave'].map({1:'1',
                                    2:'2',
                                    3:'3',
0:''})df['longitude'] = 0
df['latitude'] = 0for i in tqdm(bounded_addresses):
unom = i['unom']
coordinates = i['center']['coordinates']
df.loc[df['unom']==unom, 'longitude'] = coordinates[1]
df.loc[df['unom']==unom, 'latitude'] = coordinates[0]HBox(children=(FloatProgress(value=0.0, max=5152.0), HTML(value='')))# , ..
df.loc[(df['AO'] == '') | (df['AO'] == ''), 'AO'] = ''df[df['longitude'] == 0]| AO | district | description | unom | wave | marker-color | iconContent | longitude | latitude | |
|---|---|---|---|---|---|---|---|---|---|
| 917 | - | . (.-), .11 | 15000016 | 1 | #0ACF00 | 1 | 0.0 | 0.0 | |
| 918 | - | . (.-), .13 | 15000015 | 1 | #0ACF00 | 1 | 0.0 | 0.0 | |
| 919 | - | . (.-), .3 | 15000013 | 1 | #0ACF00 | 1 | 0.0 | 0.0 | |
| 925 | - | . (.-), .4 | 15000012 | 1 | #0ACF00 | 1 | 0.0 | 0.0 | |
| 926 | - | . (.-), .6 | 15000014 | 1 | #0ACF00 | 1 | 0.0 | 0.0 | |
| 4883 | . (. , .)... | 4405823 | 0 | #FD0006 | 0.0 | 0.0 | |||
| 4945 | . (., /), .51 | 20000002 | 0 | #FD0006 | 0.0 | 0.0 | |||
| 4946 | . (., /), .52 | 20000003 | 0 | #FD0006 | 0.0 | 0.0 | |||
| 4947 | . (., /), .53 | 20000001 | 0 | #FD0006 | 0.0 | 0.0 | |||
| 4948 | . (., /), .85 | 20000000 | 0 | #FD0006 | 0.0 | 0.0 | |||
| 4995 | (.), .1 | 20000004 | 0 | #FD0006 | 0.0 | 0.0 |
,
df.loc[917, ['longitude', 'latitude']] = 37.204805, 55.385382
df.loc[918, ['longitude', 'latitude']] = 37.205255, 55.385367
df.loc[919, ['longitude', 'latitude']] = 37.201518, 55.385265
df.loc[925, ['longitude', 'latitude']] = 37.201545, 55.384927
df.loc[926, ['longitude', 'latitude']] = 37.204151, 55.384576
df.loc[4883, ['longitude', 'latitude']] = 37.321218, 55.661308
df.loc[4945, ['longitude', 'latitude']] = 37.476896, 55.604153
df.loc[4946, ['longitude', 'latitude']] = 37.477406, 55.603895
df.loc[4947, ['longitude', 'latitude']] = 37.476546, 55.602729
df.loc[4948, ['longitude', 'latitude']] = 37.477568, 55.604659
df.loc[4995, ['longitude', 'latitude']] = 37.176806, 55.341541
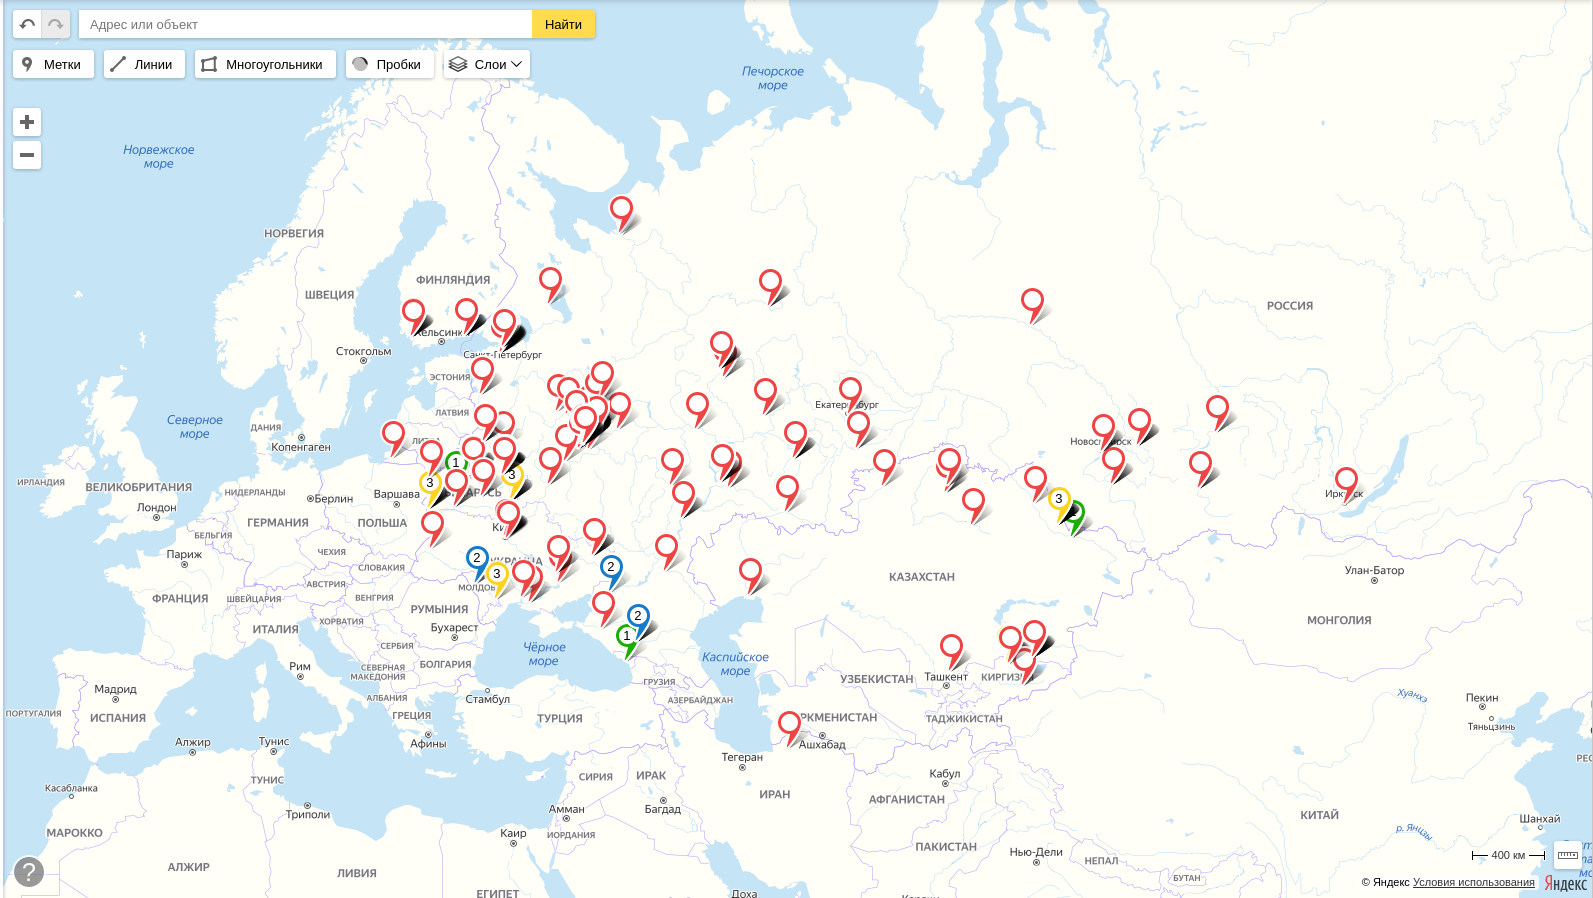
with open('start_area.txt') as f:
end = json.load(f)data = {
'AO':[],
'district':[],
'longitude':[],
'latitude':[],
'description':[]
}
for i in end['response']:
data['AO'].append(i['OKRUG'])
data['district'] = i['AREA']
coordinates = i['geoData']['coordinates']
data['longitude'].append(coordinates[1])
data['latitude'].append(coordinates[0])
description = i['Address']
if 'StartOfRelocation' in i:
if i['StartOfRelocation'] is not None:
description += '\n' + i['StartOfRelocation']
data['description'].append(description)
df_start_area = pd.DataFrame(data)
df_start_area['marker-color'] = '#7D3E00' #
df_start_area['iconContent'] = '0'
df_start_area['unom'] = None
df_start_area['wave'] = -1
df = pd.concat([df, df_start_area], ignore_index=True)
def df_to_geojson(df, properties, lat='latitude', lon='longitude'):
    geojson = {'type':'FeatureCollection', 'features':[]}
    for _, row in df.iterrows():
        feature = {'type':'Feature',
                   'properties':{},
                   'geometry':{'type':'Point',
                               'coordinates':[]}}
        feature['geometry']['coordinates'] = [row[lon],row[lat]]
        for prop in properties:
            feature['properties'][prop] = row[prop]
        geojson['features'].append(feature)
return geojsonproperties = ['marker-color', 'iconContent', 'description'].
if not os.path.exists('data'):
os.makedirs('data')
for ao, data in df.groupby('AO'):
geojson = df_to_geojson(data, properties)
with open('data/' + ao + '.geojson', 'w') as f:
json.dump(geojson, f, indent=2) ( )
geojson = df_to_geojson(df, properties)

with open('data/_.geojson', 'w') as f:
json.dump(geojson, f, indent=2) , , , , , , , .
UPD 28 2020
.
PbIXTOP , .
UPD 1 2020
マップを形成するための最新のコードを追加し、実装を非表示にしました。記事のほとんどの読者は地図にのみ興味があります。
清聴ありがとうございました。