こんにちは、読者の皆様!購入年齢、頻度、取引量による顧客のセグメンテーションのこの方法については、かなり多くの資料が書かれています。インターネットでは、rfm分析の理論と実践を説明する出版物を簡単に見つけることができます。スプレッドシートエディタのプラットフォーム(少量のデータ)と、SQLクエリまたはPython / Rテーマライブラリの両方を使用して実行できます。すべての例の方法論は同じであり、不一致は詳細にのみあります。たとえば、セグメントに番号を割り当てる順序や、グループへの分割の原則などです。上記のすべてを考慮すると、このトピックに斬新さをもたらすことは難しいでしょう。この記事では、初心者のデータアナリストに役立ついくつかのポイントにのみ注意を向けようとします。
スクリプトがどのように機能するかを示すために、AnacondaからPostgreSQLとJupyterLabを選択しました。投稿に表示されるすべてのコード例は、GitHub(リンク)にあります。分析用のデータは、Kaggleポータル(リンク)から取得されました。
データセットをデータベースにロードする前に、事前にデータの品質がわからない場合は、データを調べてください。日付、レコードのギャップ、フィールドのタイプの誤った定義を含む列には特に注意を払う必要があります。デモを簡単にするために、アイテムの返品エントリも拒否しました。
import pandas as pd
import numpy as np
import datetime as dt
pd.set_option('display.max_columns', 10)
pd.set_option('display.expand_frame_repr', False)
df = pd.read_csv('dataset.csv', sep=',', index_col=[0])
#
df.columns = [_.lower() for _ in df.columns.values]
# -
df['invoicedate'] = pd.to_datetime(df['invoicedate'], format='%m/%d/%Y %H:%M')
df['invoicedate'] = df['invoicedate'].dt.normalize()
#
df_for_report = df.loc[(~df['description'].isnull()) &
(~df['customerid'].isnull()) &
(~df['invoiceno'].str.contains('C', case=False))]
#
convert_dict = {'invoiceno': int, 'customerid': int, 'quantity': int, 'unitprice': float}
df_for_report = df_for_report.astype(convert_dict)
#
# print(df_for_report.head(3))
# print(df_for_report.dtypes)
# print(df_for_report.isnull().sum())
# print(df_for_report.info())
# csv
df_for_report.to_csv('dataset_for_report.csv', sep=";", index=False)
次のステップは、データベースに新しいテーブルを作成することです。これは、pgAdminユーティリティを使用したグラフィカルエディタモードとPythonコードの両方で実行できます。
import psycopg2
#
conn = psycopg2.connect("dbname='db' user='postgres' password='gfhjkm' host='localhost' port='5432'")
print("Database opened successfully")
#
cursor = conn.cursor()
with conn:
cursor.execute("""
DROP TABLE IF EXISTS dataset;
""")
cursor.execute("""
CREATE TABLE IF NOT EXISTS dataset (
invoiceno INTEGER NOT NULL,
stockcode TEXT NOT NULL,
description TEXT NOT NULL,
quantity INTEGER NOT NULL,
invoicedate DATE NOT NULL,
unitprice REAL NOT NULL,
customerid INTEGER NOT NULL,
country TEXT NOT NULL);
""")
print("Operation done successfully")
#
cursor.close()
conn.close()
, . PostgreSQL. , . Pandas.
import psycopg2
from datetime import datetime
start_time = datetime.now()
#
conn = psycopg2.connect("dbname='db' user='postgres' password='gfhjkm' host='localhost' port='5432'")
print("Database opened successfully")
#
cursor = conn.cursor()
# .
with open('dataset_for_report.csv', 'r') as f:
next(f)
cursor.copy_from(f, 'dataset',sep=';', columns=('invoiceno', 'stockcode', 'description', 'quantity',
'invoicedate','unitprice', 'customerid', 'country'))
conn.commit()
f.close()
print("Operation done successfully")
#
cursor.close()
conn.close()
end_time = datetime.now()
print('Duration: {}'.format(end_time - start_time))
rfm-. , , sql. , ( Hadoop ). rfm- : , .
. , ( Pandas – cut qcut) . , . , , - . -, . , . , : , . , -.
-- rfm-
create function func_recency(days integer) returns integer as $$
select case when days<90 then 1
when (days>=90) and (days<=180) then 2
else 3
end;
$$ language sql;
create function func_frequency(transactions integer) returns integer as $$
select case when transactions>50 then 1
when (transactions>=10) and (transactions<=50) then 2
else 3
end;
$$ language sql;
create function func_monetary(amount integer) returns integer as $$
select case when amount>10000 then 1
when (amount>=1000) and (amount<=10000) then 2
else 3
end;
$$ language sql;
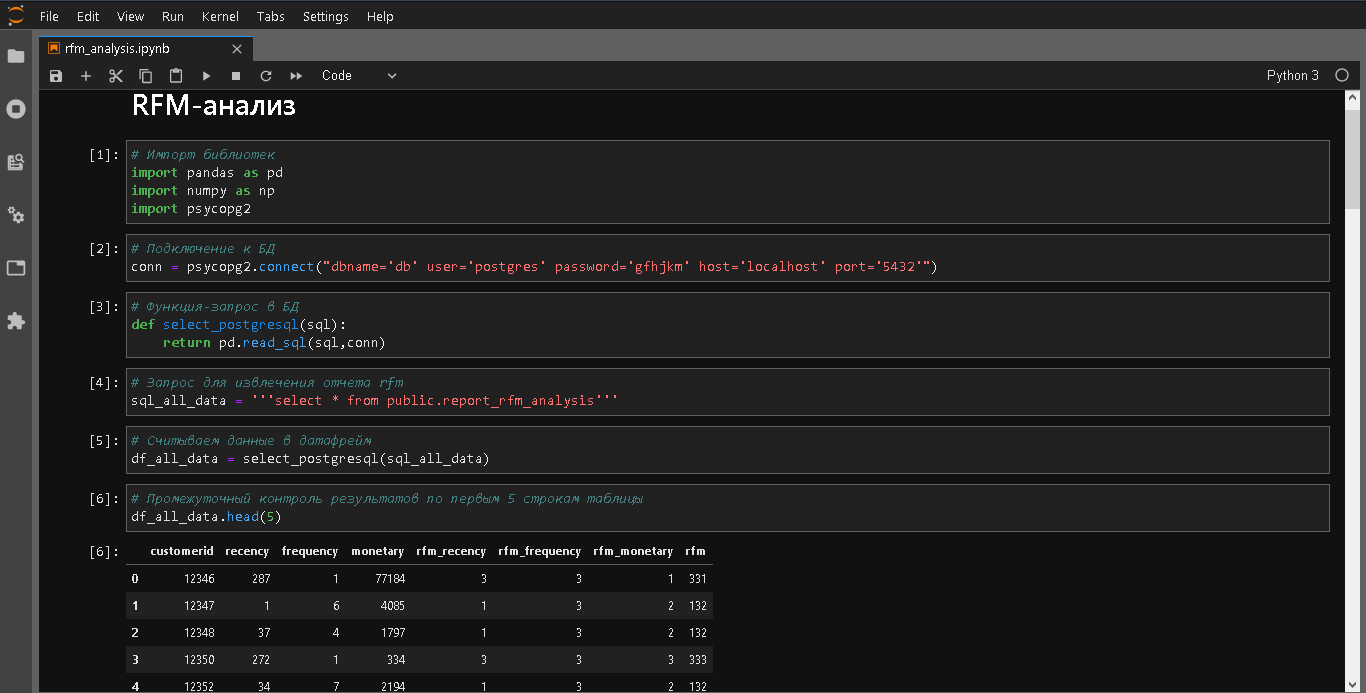
, rfm-. . . , , . , , , , , – . , rfm-. sql- BI JupyterLab.
-- rfm-
select d3.*, concat(d3.rfm_recency,d3.rfm_frequency,d3.rfm_monetary) as rfm
from
(select d2.customerid,
date('2011-11-01')- max(d2.invoicedate) as recency,
cast(count(distinct(d2.invoiceno)) as integer) as frequency,
cast(sum(d2.amount) as integer) as monetary,
func_recency(date('2011-11-01')- max(d2.invoicedate)) as rfm_recency,
func_frequency(cast(count(distinct(d2.invoiceno))as integer)) as rfm_frequency,
func_monetary(cast(sum(d2.amount)as integer)) as rfm_monetary
from
(select d.*, d.quantity * d.unitprice as amount
from public.dataset as d
where d.invoicedate < date('2011-11-01')) as d2
group by d2.customerid
order by d2.customerid) as d3;
, . -, rfm- , , -, , , .
? . . , - . , , 50 , . ? , . , , . , , , 5000 , . 500 , . Sql- . , JupyterLab .
-- , ,
select r.rfm,
sum(r.monetary) as total_amount,
count(r.rfm) as count_customer,
cast(avg(r.monetary/r.frequency) as integer) as avg_check
from public.report_rfm_analysis as r
group by r.rfm;
. , . -, . - , 70% . .
--
select d2.rfm,
d2.country,
cast(sum(d2.amount) as integer) as amount_country,
round(cast(sum(d2.amount)/sum(sum(d2.amount))over(partition by d2.rfm)*100 as numeric),2) as percent_total_amount
from
(select d.*, d.quantity * d.unitprice as amount, r.rfm
from public.dataset as d left join
public.report_rfm_analysis as r on d.customerid = r.customerid
where d.invoicedate < date('2011-11-01')) as d2
group by d2.rfm, d2.country
order by d2.rfm, sum(d2.amount)desc;
. : , -7 , -3 , . . , , . , - , - , , . . クライアントとのコミュニケーションが必然的に最もターゲットを絞っている場合。このアプローチを実証するために、セグメント国のコンテキストで売上高の上位3日間の計算を実装しました。
--
create function func_day_of_week(number_day integer) returns text as $$
select (string_to_array('sunday,monday,tuesday,wednesday,thursday,friday,saturday',','))[number_day];
$$ language sql;
-- -3 -
select d4.rfm, d4.country, max(d4.top) as top_3_days
from
(select d3.rfm, d3.country, string_agg(d3.day_of_week,', ')over(partition by d3.rfm, d3.country) as top
from
(select d2.rfm, d2.country, d2.day_of_week,sum(d2.amount) as total_amount,
row_number ()over(partition by d2.rfm, d2.country order by d2.rfm, d2.country, sum(d2.amount)desc)
from
(select r.rfm,
d.country,
func_day_of_week(cast(to_char(d.invoicedate, 'D') as integer)) as day_of_week,
d.quantity * d.unitprice as amount
from public.dataset as d left join public.report_rfm_analysis as r on d.customerid = r.customerid
where d.invoicedate < date('2011-11-01')) as d2
group by d2.rfm, d2.country, d2.day_of_week
order by d2.rfm, d2.country, sum(d2.amount) desc) as d3
where d3.row_number <= 3) as d4
group by d4.rfm, d4.country
簡単な結論。RFM分析とその補助計算は、SQLノートブックとPythonノートブックを組み合わせることで最も便利に実行されます。顧客をセグメント化するときは、事業領域、マーケティングポリシー、および広告の目標を考慮することが重要です。RFMレポートは全体像を示しているわけではないため、補助的な計算を伴うことが最善です。
それで全部です。すべての健康、幸運、そしてプロとしての成功!