いくつかのmatplotlibプロットがあります。それらを単一のpdfファイルに保存する必要があります。何をすべきか?
方法I.PdfPagesを使用して1つのページに1つのグラフを保存する
このメソッドは、2つのオプションを使用して実装できます。
matplotlibマジックの使用:
from matplotlib.backends.backend_pdf import PdfPages
import matplotlib.pyplot as plt
import numpy as np
# .
pdf = PdfPages("Figures.pdf")
# .
FUNCTIONS = [np.sin, np.cos, np.sqrt, lambda x: x**2]
X = np.linspace(-5, 5, 100)
for function in FUNCTIONS:
plt.plot(X, function(X))
pdf.savefig()
plt.close()
#
pdf.close()
図形への直接アクセスの使用:
from matplotlib.backends.backend_pdf import PdfPages
import matplotlib.pyplot as plt
import numpy as np
# .
FUNCTIONS = [np.sin, np.cos, np.sqrt, lambda x: x**2]
X = np.linspace(-5, 5, 100)
figures = []
for function in FUNCTIONS:
figure = plt.figure()
axes = figure.subplots()
axes.plot(X, function(X))
figures.append(figure)
# .
# figures = []
# .
pdf = PdfPages("Figures.pdf")
for figure in figures:
pdf.savefig(figure)
#
pdf.close()
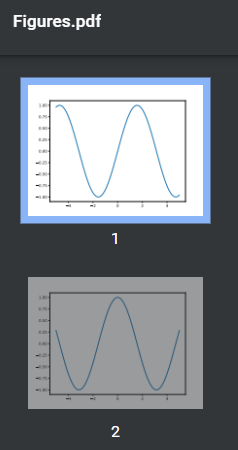
我々が得る:

方法II。PdfPagesを使用して1ページに複数のグラフを保存する
from matplotlib.backends.backend_pdf import PdfPages
import matplotlib.pyplot as plt
import numpy as np
#
FUNCTIONS = [np.sin, np.cos, np.sqrt, lambda x: x**2, np.tan]
X = np.linspace(-5, 5, 100)
#
ROWS = 2
COLUMNS = 2
# .
pdf = PdfPages("Figures.pdf")
#
index = 0
for page in range(len(FUNCTIONS)//(ROWS*COLUMNS)+1):
# .
figure = plt.figure(figsize=(12, 12))
axes = figure.subplots(ROWS, COLUMNS)
#
for row in range(ROWS):
for column in range(COLUMNS):
if index < len(FUNCTIONS):
axes[row, column].plot(X, FUNCTIONS[index](X))
index += 1
#
pdf.savefig(figure)
#
pdf.close()
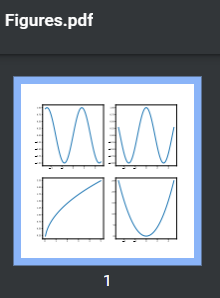
我々が得る:

すでに具体的な形状の配列がある場合、これは機能しません。この単純な理由で、図はすでに必要なものが描かれています。さらに、各形状には独自のdpiとサイズがあり、レンダリングに影響します。もちろん、アルゴリズムを複雑にすることでこれらすべてを考慮に入れることができますが、方法3に進む方がはるかに簡単です。
方法III。reportlabの使用
最も用途の広い方法。
import matplotlib.pyplot as plt
import numpy as np
from io import BytesIO
from reportlab.pdfgen import canvas
from reportlab.lib.units import cm
from reportlab.lib.utils import ImageReader
# .
FUNCTIONS = [np.sin, np.cos, np.sqrt, lambda x: x**2]
X = np.linspace(-5, 5, 100)
figures = []
for function in FUNCTIONS:
figure = plt.figure()
axes = figure.subplots()
axes.plot(X, function(X))
figures.append(figure)
# .
# figures = []
#
indent = 1.5
# canvas
c = canvas.Canvas("Figures.pdf")
c.setTitle("Figures")
height = indent
# .
for figure in figures:
# dpi ( )
dpi = figure.get_dpi()
figureSize = figure.get_size_inches()
# .
# , .
figure.patches.extend(
[plt.Rectangle((0, 1/(dpi*figureSize[1])), width=1-2/(dpi*figureSize[0]),
height=1-2/(dpi*figureSize[1]),
transform=figure.transFigure, figure=figure, clip_on=False,
edgecolor="black",
facecolor="none", linewidth=1)])
# .
image = BytesIO()
figure.savefig(image, format="png")
image.seek(0)
image = ImageReader(image)
# .
figureSize = figure.get_size_inches()*2.54
# A4 210×297
# ,
if height + figureSize[1] + indent > 29.7:
height = indent
c.showPage()
# image pdf
c.drawImage(image, (10.5-figureSize[0]/2)*cm, height*cm,
figureSize[0]*cm, figureSize[1]*cm)
height += figureSize[1]
# .
c.save()
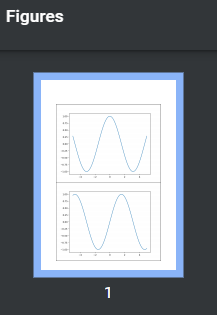
我々が得る:

記事を読んでくれてありがとう。がんばろう!