Virtuozzo と OpenVZ のユーザーは通常、当社のソフトウェアを実行している多くのデプロイ済みマシンで作業します。したがって、そのようなサーバーのフリート全体の集中監視を開始することは理にかなっています。そして今日は、Prometheus に基づく Virtuozzo ハイブリッド インフラストラクチャの組み込み監視サービスを使用する方法を説明します。

VHS, Virtuozzo Storage. Storage, GUI ( OpenVZ, Virtuozzo Storage , ), .
( OpenVZ ) : Linux , Virtuozzo Zabbix Prometheus.
Prometheus – , .
Prometheus - VHS node_exporter ( , ) libvirt_exporter ( , libvirt). , Virtuozzo .
, Prometheus Grafana, – Alertmanager.
Prometheus, Grafana Alertmanager , . Virtuozzo Hybrid Server, VHS. , Virtuozzo Linux 8; :
# prlctl create promct --vmtype=ct --ostemplate=vzlinux-8-x86_64
# prlctl set promct --cpu 2
# prlctl set promct --memsize 2G
IP , .
:
# timedatectl set-timezone 'Europe/Moscow'
firewall – 9090 - Prometheus, 9093 AlertManager 3000 Grafana. , Prometheus Alertmanager , .
# firewall-cmd --zone=public --permanent --add-port=9090/tcp
# firewall-cmd --zone=public --permanent --add-port=9093/tcp
# firewall-cmd --zone=public --permanent --add-port=3000/tcp
# firewall-cmd --reload
Prometheus & co.
Prometheus , Virtuozzo Linux 8, :
# yum install prometheus
(, , - - ), GitHub /opt ( ). , 2.21.0:
# cd /opt
# wget https://github.com/prometheus/prometheus/releases/download/v2.21.0/prometheus-2.21.0.linux-amd64.tar.gz
# tar -xzf prometheus*.tar.gz
- ( ) service- systemd, :
# cat /lib/systemd/system/prometheus.service
[Unit]
Description=Prometheus
Wants=network-online.target
After=network-online.target
[Service]
Type=simple
WorkingDirectory=/opt/prometheus-2.21.0.linux-amd64
Restart=on-failure
ExecStart=/opt/prometheus-2.21.0.linux-amd64/prometheus
[Install]
WantedBy=multi-user.target
Alertmanager - :
# yum install alertmanager
... , service-:
# wget https://github.com/prometheus/alertmanager/releases/download/v0.21.0/alertmanager-0.21.0.linux-amd64.tar.gz
# cd /opt
# tar -xzf alertmanager*.tar.gz
# cat /usr/lib/systemd/system/alertmanager.service
[Unit]
Description=Alertmanager
Wants=network-online.target
After=network-online.target
After=prometheus.service
[Service]
Type=simple
WorkingDirectory=/root/alertmanager-0.21.0.linux-amd64
Restart=on-failure
ExecStart=/root/alertmanager-0.21.0.linux-amd64/alertmanager --config.file=alertmanager.yml
[Install]
WantedBy=multi-user.target
Grafana rpm-, , , :
# yum install grafana
:
# yum install https://dl.grafana.com/oss/release/grafana-7.1.5-1.x86_64.rpm
Virtuozzo Hybrid Server
VHS, , :
# yum install node_exporter libvirt_exporter
Prometheus, - 9177 libvirt_exporter 9100 node_exporter. Prometheus, :
# firewall-cmd --permanent --zone=public --add-rich-rule='
rule family="ipv4"
source address="1.2.3.4/32"
port protocol="tcp" port="9177" accept'
# firewall-cmd --permanent --zone=public --add-rich-rule='
rule family="ipv4"
source address="1.2.3.4/32"
port protocol="tcp" port="9100" accept'
# firewall-cmd --reload
"1.2.3.4" Prometheus.
, :
# systemctl enable node_exporter
# systemctl enable libvirt-exporter
# systemctl start node_exporter
# systemctl start libvirt-exporter
- , .
Prometheus
Prometheus Yaml-. , — . Virtuozzo, VHS 7 vz-prometheus-cfg . VHS 7, Prometheus VzLinux 8 — :
# yum install vz-prometheus-cfg
/usr/share/vz-prometheus-cfg/, prometheus-example.yml.
prometheus.yml , Prometheus. , – *rules.yml *alerts.yml, /usr/share/vz-prometheus-cfg/ Prometheus. , .
vz-rules, (, , ) ( - , ).
, , target-. (, node_exporter 9100, libvirt - 9177):
# cat my-vz-libvirt.yml
- labels:
group: my-vz-deployment
targets:
- my.node1:9177
- my.node2:9177
# cat my-vz-node.yml
- labels:
group: my-vz-deployment
targets:
- my.node1:9100
- my.node2:9100
scrape_configs prometheus.yml:
scrape_configs:
...
- job_name: node
...
file_sd_configs:
- files:
- /root/prometheus-2.21.0.linux-amd64/targets/my-vz-node.yml
- job_name: libvirt
...
file_sd_configs:
- files:
- /root/prometheus-2.21.0.linux-amd64/targets/my-vz-libvirt.yml
: https://docs.virtuozzo.com/virtuozzo_hybrid_server_7_users_guide/advanced-tasks/monitoring-via-prometheus.html. , job_name — . — .
- :
# systemctl start prometheus
# systemctl start alertmanager
# systemctl start grafana-server
Grafana Alertmanager
Grafana - http://<->:3000. - - "admin" / "admin".
- "Prometheus" , Configuration -> Data Sources -> "Add data source", "Prometheus" http://localhost:9090 .
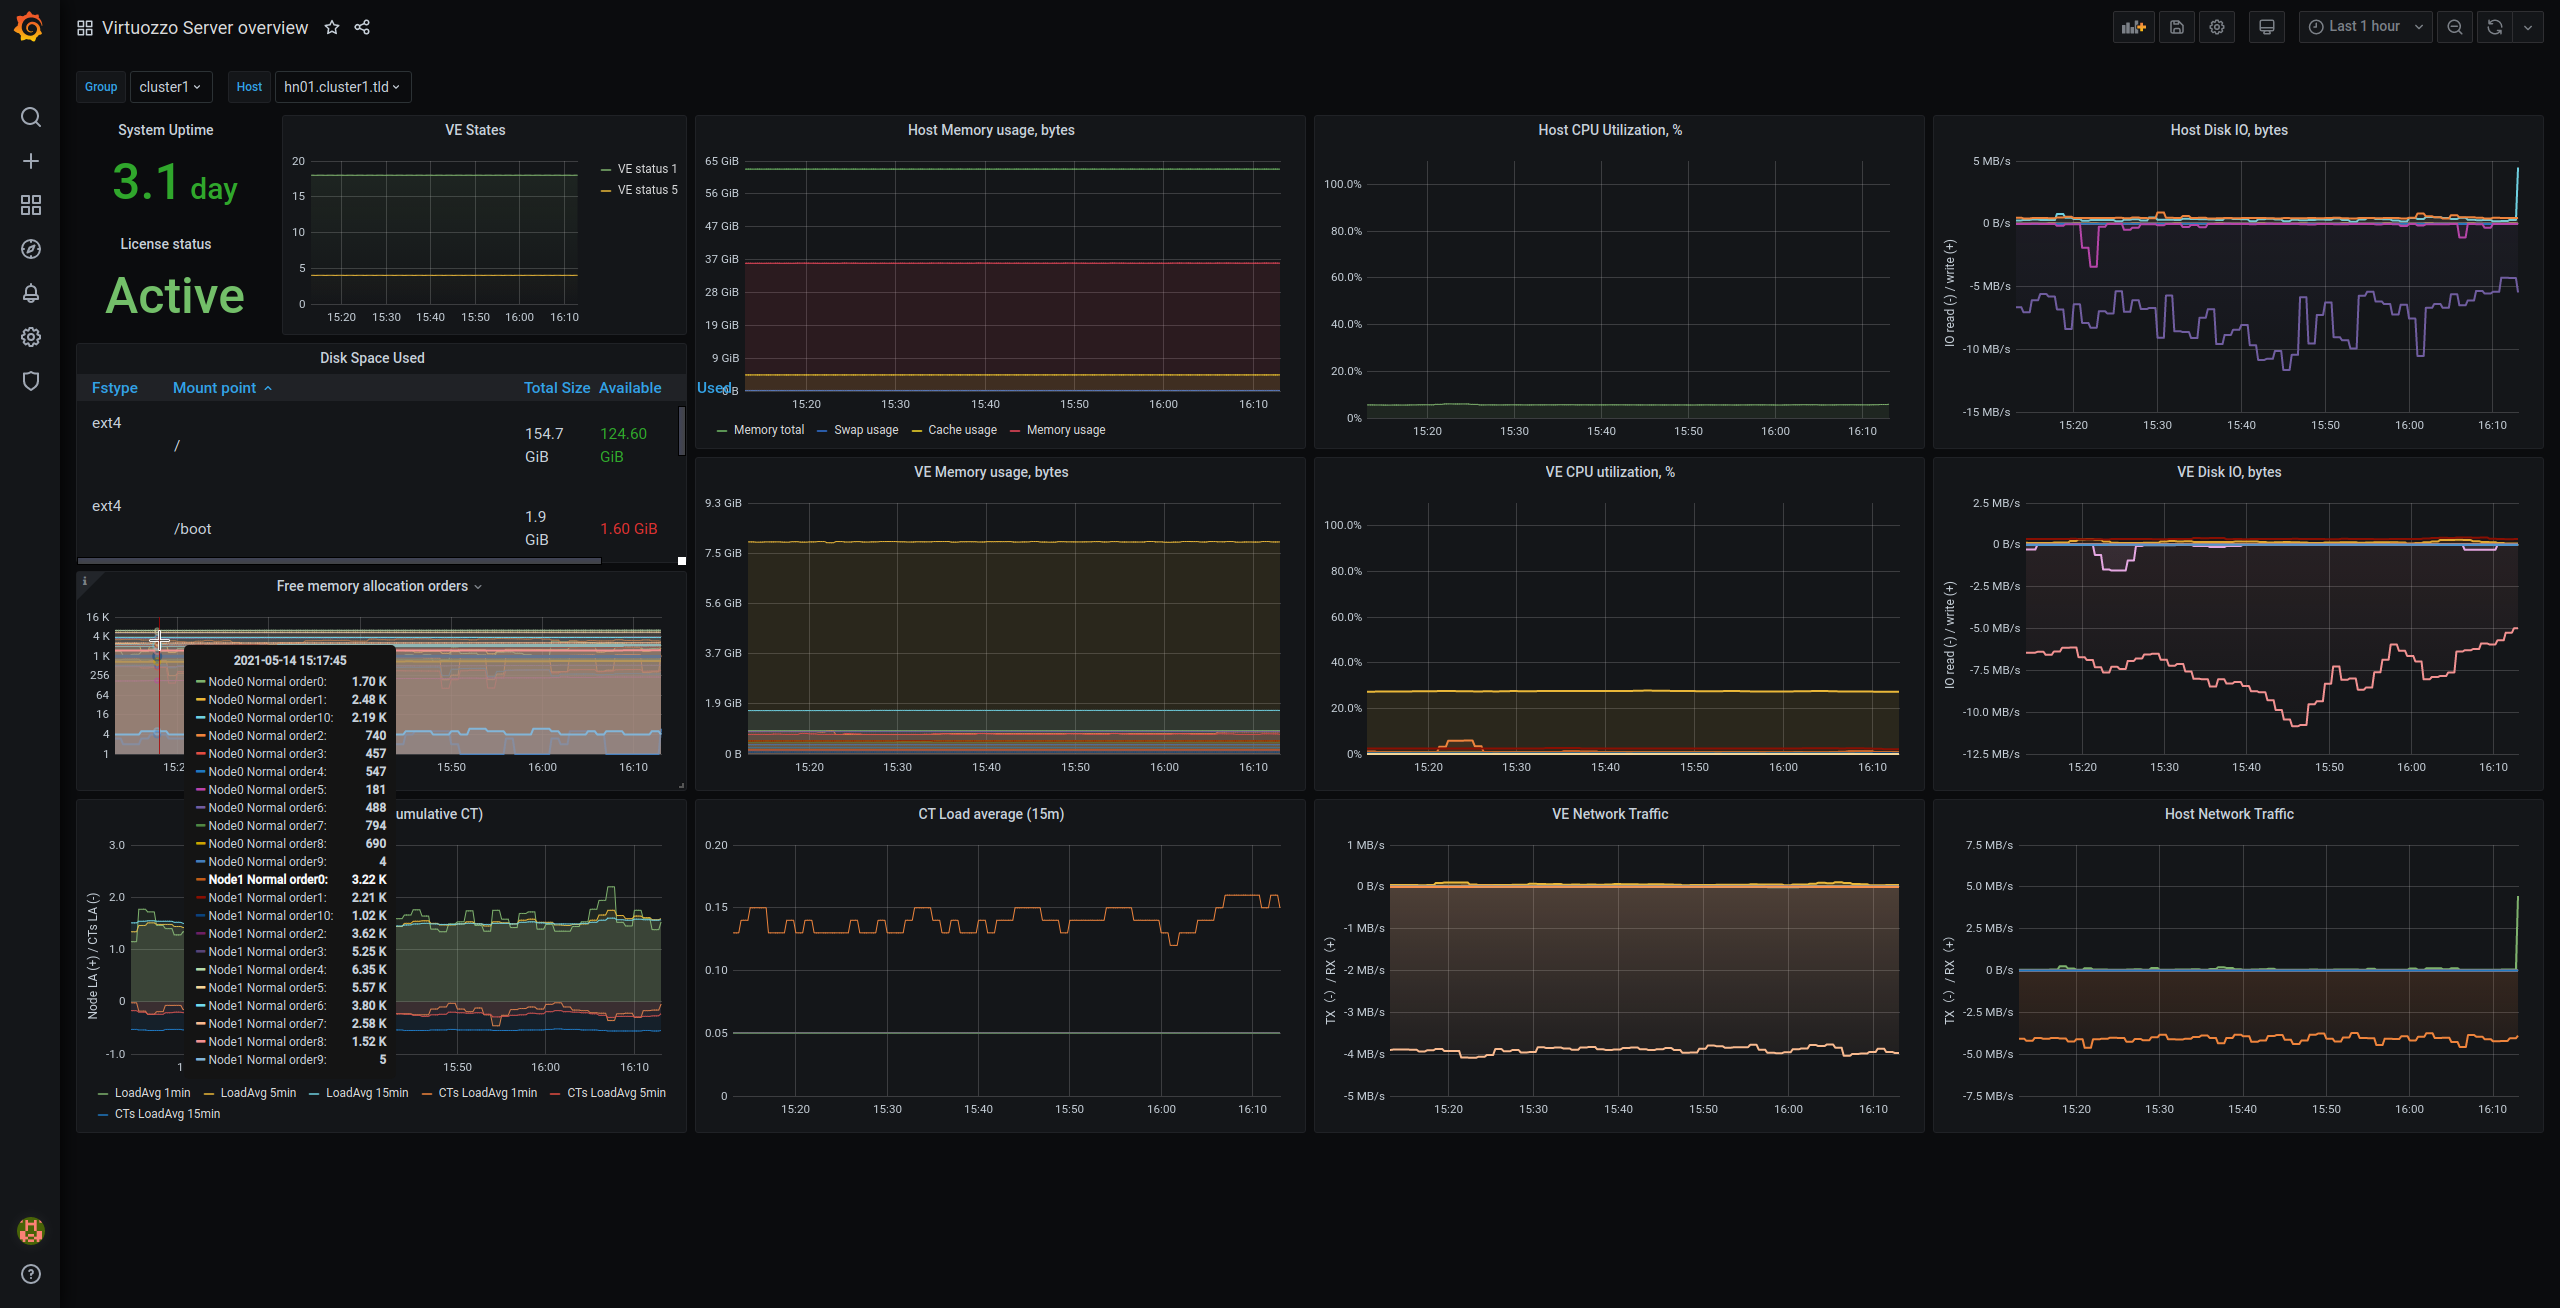
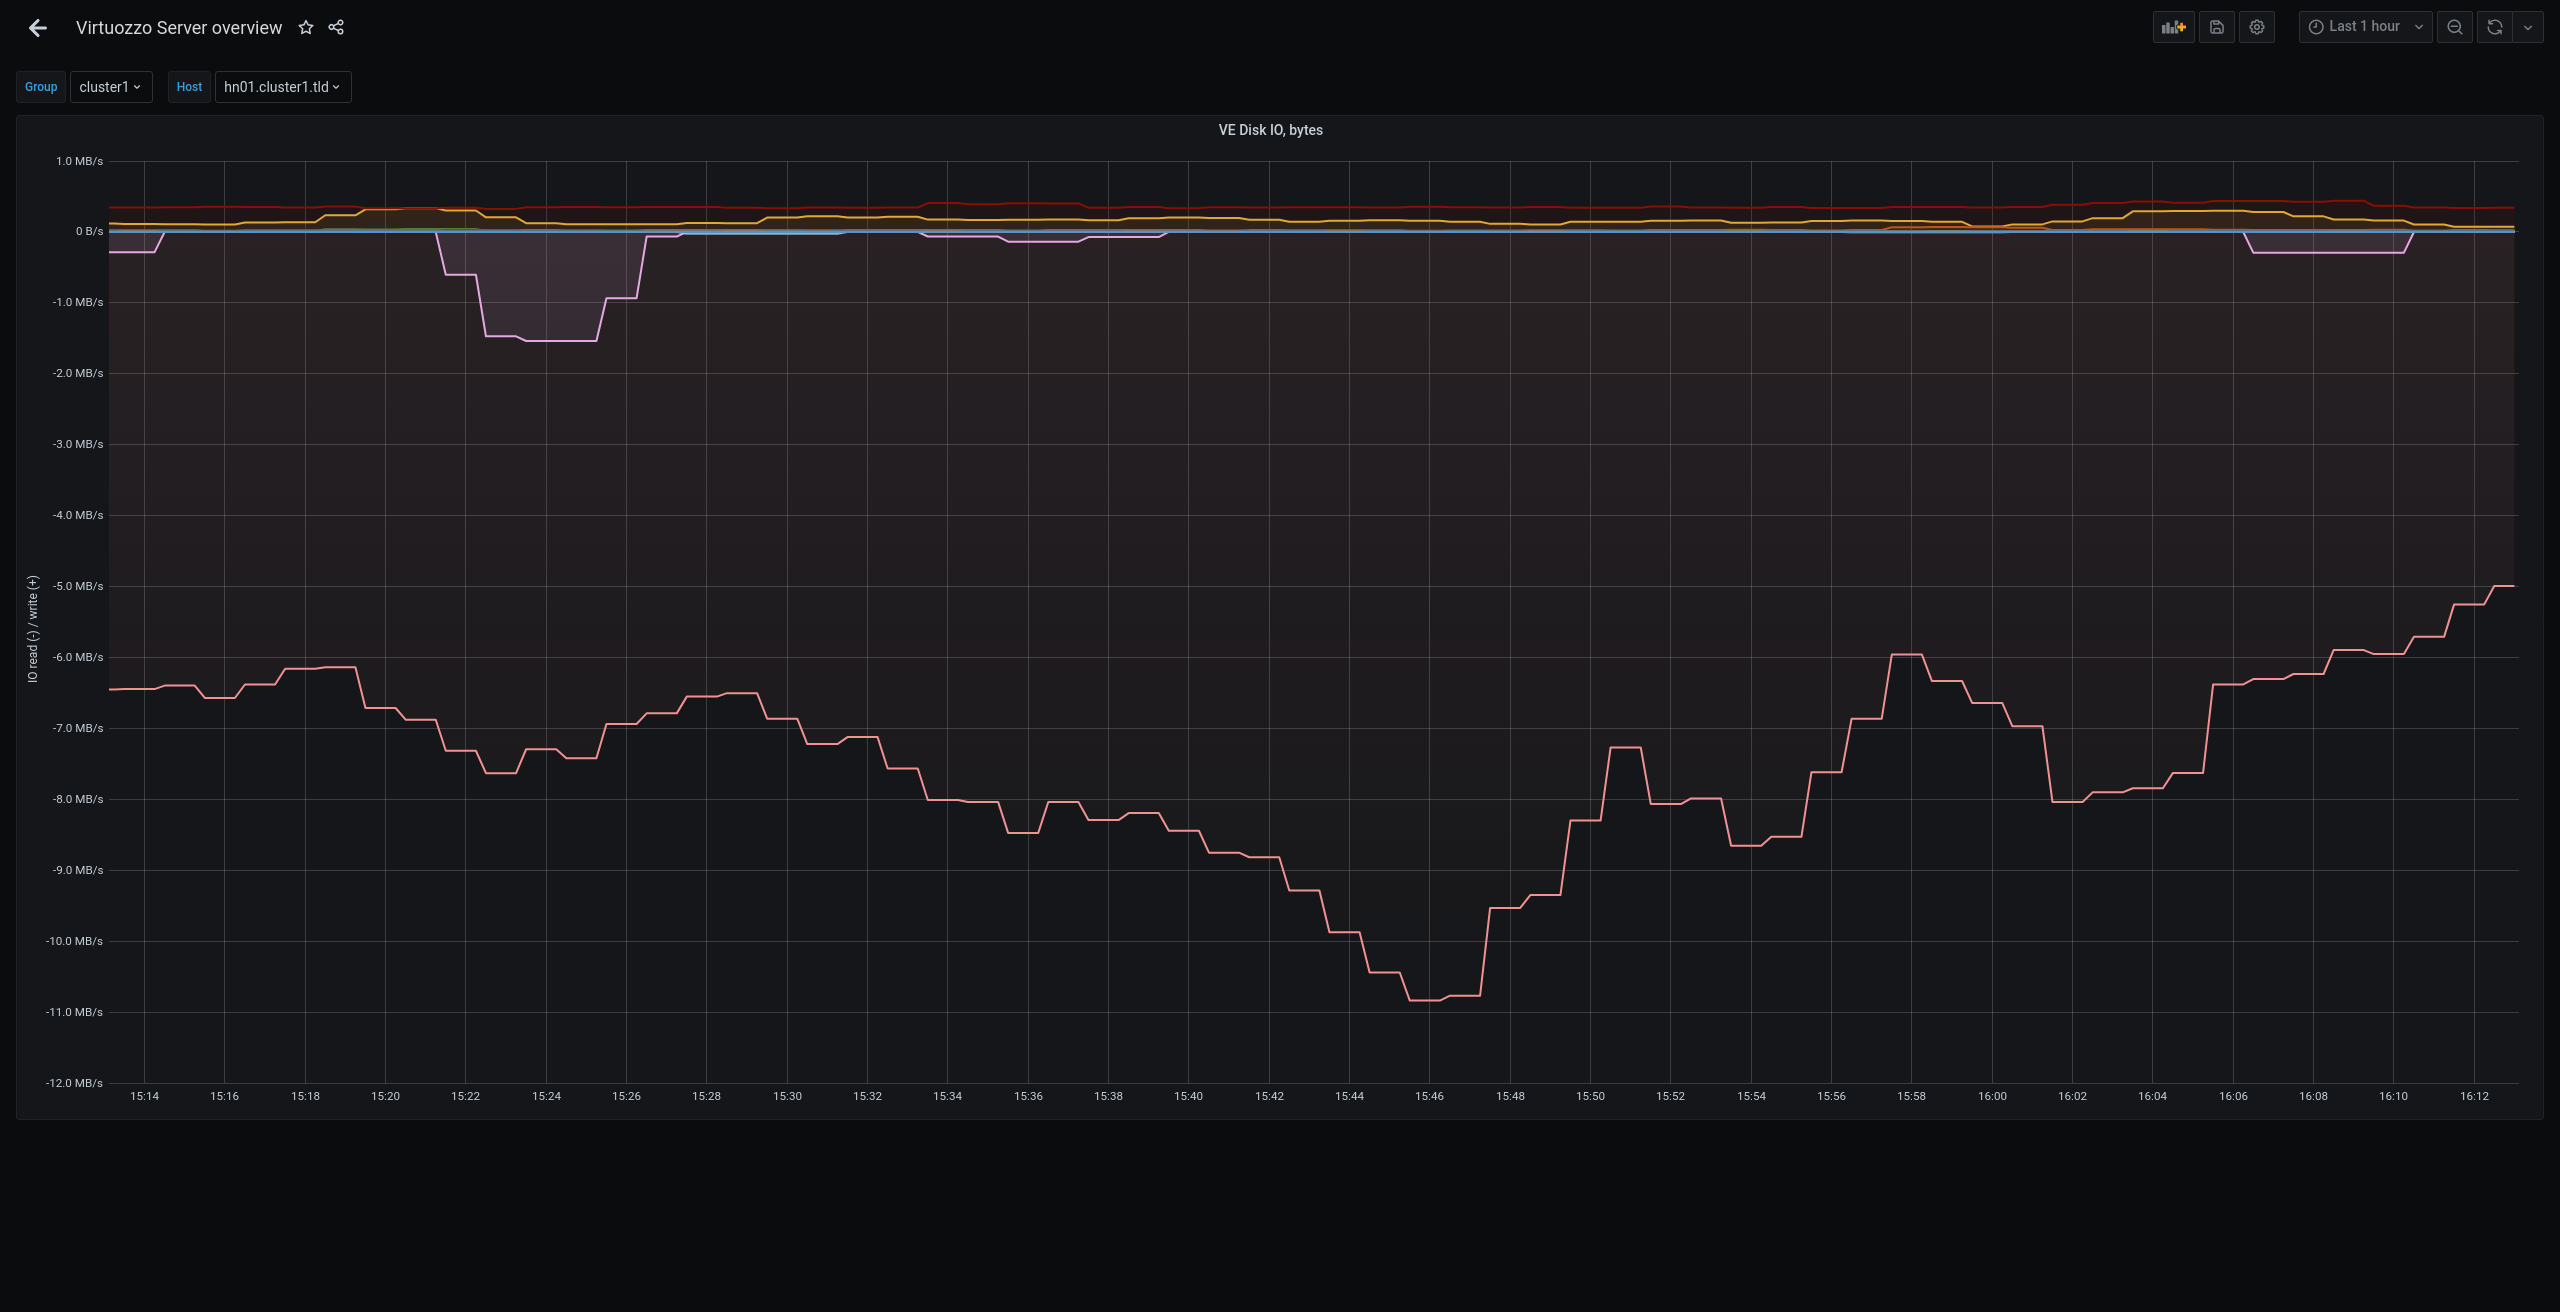
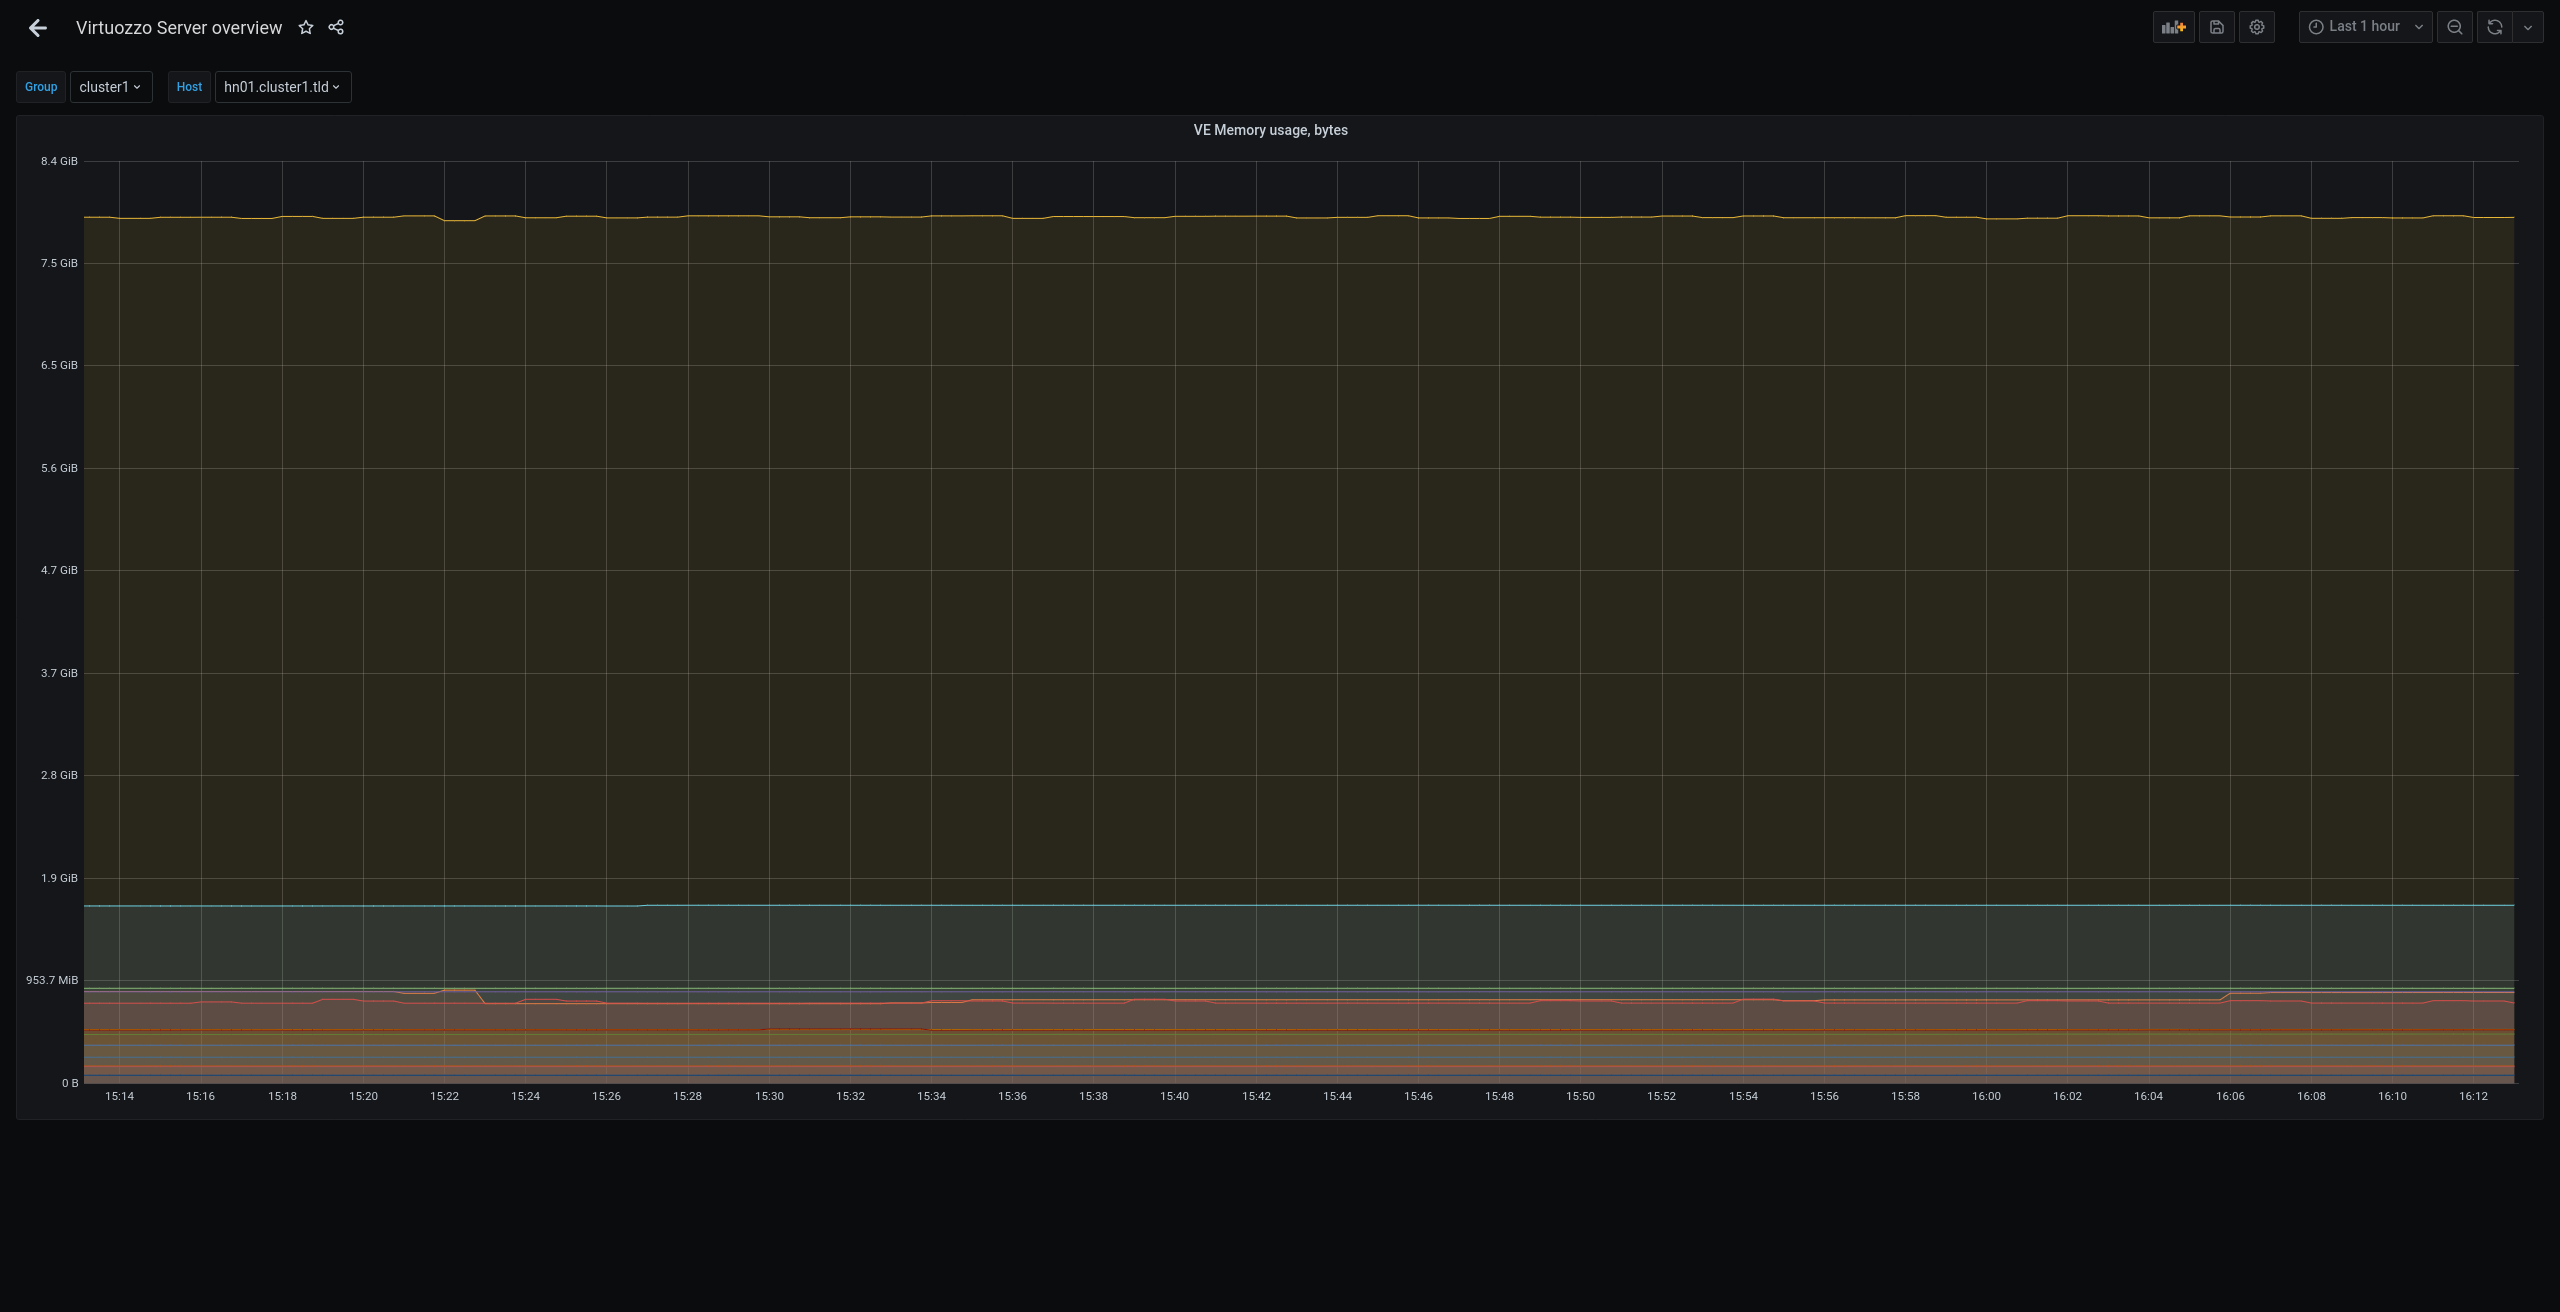
json-, vz-prometheus-cfg - grafana_hn_dashboard.json grafana_ve_dashboard.json - . "Dashboards" -> "Manage" -> "Import", Prometheus.
, , – Prometheus - , .
, Alertmanager – , - “ Virtuozzo” . , , email /etc/alertmanager/alertmanager.yaml:
route: receiver: 'email'
group_by: ['alertname', 'cluster'] group_wait: 30s group_interval: 5m repeat_interval: 3h receivers: - name: 'email' email_configs: - to: 'admin@myserver.com' from: 'vz-alert@myserver.com' smarthost: smtp.myserver.com:587
, Prometheus. , Virtuozzo . , , .